It may not feel like it, but slowly and surely we are becoming smarter golf fans.
It may not feel like it because we spent the weekend wandering through a maze, searching for which NBC destination was currently hosting the golf. And it may not feel like it since the discourse surrounding the course invoked “woke” more often than any other word. But for those golf fans who can manage a little digging, we are truly smarter than ever. (This is a column about statistics. Click away now if numbers make your head spin.)
To be a golf fan these days is to be a digger. You’ve got to click around to find what you want, but recently one of those mandatory places worth visiting is the actual website of the event itself. That hasn’t always been the case, but they’re the ones with all the data.
Nothing is more valuable to telling the story of the modern game than that four-letter d-word. Data. And governing bodies like the USGA have, over time, been convinced of its value. For years in private, but now in a much more public fashion, just a few clicks away.
This year, the USGA’s data holdings brought back a full fleet of Strokes Gained stats, the industry standard, but along with it a a couple new offerings. Firstly, Missed Fairway Penalty. The name speaks for itself, especially at a U.S. Open: What is the penalty incurred from missing fairways? For a player like Dustin Johnson, who played well enough to finish T19, it was glaring.
Missed Fairway Penalty
Johnson hit just 37.5% of his fairways last weekend, among the worst in the field of those who made the cut. Was it a big deal that DJ was missing fairways? Matthew Wolff seemed to be getting around just fine, missing the short grass just as frequently. The truth is in the Missed Fairway Penalty stat. An algorithm of expected strokes pitted against actual results show that all those DJ misses added up to a penalty of 11.87 strokes over the course of the tournament. Xander Schauffele, who hit 14 more fairways and finished three shots closer to the lead, just so happened to have a Missed Fairway Penalty of 6.9, four shots better than DJ’s. Can we ever expect that number to be zero? No. Chez Reavie hit 75% of his fairways and missing the short grass still cost him an event-best 4.61 strokes, but when the best players in the world miss more than they are used to, we can pinpoint the costliest now more than ever. It’s a figure and storyline the USGA is keen to bring to viewers who just want more information.
“A traditional stat like Fairways Hit is a very good directional,” said Scott Lipsky, senior manager of digital media with the USGA. “But this just allows us to sort of peel one layer deeper and kind of show how they’re recovering once they’ve actually missed the fairway.”
The stat is indicative of not just what happens when players miss fairways, but which players are most skilled playing from the rough, or even the amount of luck implied for certain players who catch better lies than others. Kevin Streelman hit six more fairways than Johnson and Wolff did, but his play from the rough was poor enough that his penalty for missing was basically the same. Is that bad luck, or just Streels struggling from the long stuff? Each day the stat makes you wonder what could have been, in the same way Bryson DeChambeau might be thinking today after he missed the 13th fairway and a confluence of mistakes resulted in a triple-bogey 8 down the stretch.
Win Probability
Also debuted this year was a commitment to win probability. This stat is nothing new to the golf world, as various sites (and sports books) spend endless hours refining algorithms to measure how likely a tournament result is as the birdies and bogeys flow in. But for the USGA, again, it’s a commitment to giving viewers more. The governing body actually created content around the idea this year, with daily videos showing off the shots that created the greatest boost in expected win percentage. On Thursday, the fluctuation isn’t going to be nearly as significant as Sunday. But sure enough, down the stretch, their algorithm was put to a stiff test: Jon Rahm flipping the script on Louis Oosthuizen with two unlikely birdie putts dropping in the span of 15 minutes.
An absolutely LEGENDARY finish!@JonRahmPGA closes birdie-birdie on 17 and 18 to become the 121st #USOpen champion! pic.twitter.com/pfKmYlIAYe
— U.S. Open (@usopengolf) June 21, 2021
Rahm’s first putt came from 24 feet and while he was in a one-shot deficit, and when it dropped his win probability soared some 27.4%, from 37.7% up to 65.1%, per the USGA. Not long later, another birdie that looked almost identical (though six feet shorter) fell into the cup and boosted his probability another 15.4%, up to 80.5%. Louis Oosthuizen had two holes left, and clearly a 19.5% chance of playing them in a collective one under. When his tee shot dove into the ravine off the 17th, the event was basically finished.
To make all this analytical magic happen, the USGA leans on two different companies, SportsMedia Technology and Twenty First Group, the new home of the brand formerly known as the 15th Club, which describes itself as a sports intelligence firm. Those familiar with the work of 15th Club (aiding the European Ryder Cup team) or Justin Ray (golf stat wizard) can trust the figures shared by the USGA, and know that every year, there will be more ideas coming down the road.
“We know that we have stories we want to tell as an organization,” Lipsky said. “They provide us some really good ideas of ways that we can tell those stories. SMT is our scoring provider. They’re providing all the actual scoring data. Twenty First Group does a great job of interpreting that. And then it allows us as an organization to tell the story the way we think would be best for fans to engage with it.”
Golf Course Heat Maps
Thankfully, there are many others issuing in the future right alongside (and even in front of) the governing bodies. Another noteworthy piece of analytical brilliance came from the DataGolf team, which comes as no surprise. The brand, run by two brothers from Canada, is a leading force in helping viewers (and particularly gamblers) understand how an event might play out. If you’ve visited their site, you’ve no doubt stumbled upon their Course Fit Tool, that ranks players by how their game sets up to a given course, or their Live Cut Line, which is vital to understanding Friday afternoon golf on the PGA Tour.
But new for them this week was a bushel of Torrey Pines Shotlink data mashed into visually appealing diagrams known as heat maps. DataGolf was able to pinpoint the general regions where birdies and bogeys have been made at the South Course. Does it make sense to go right at the short pin on 3, knowing that it’s possible we leave the approach in the bunker? Or does being long and potentially on the green lead to a lower expected stroke total? Where can long gt me in trouble, though?
Every player’s skillset from different areas is different, but there were some obvious places to be, and places to not be off the tee at Torrey Pines. Take the 2nd hole, for example.
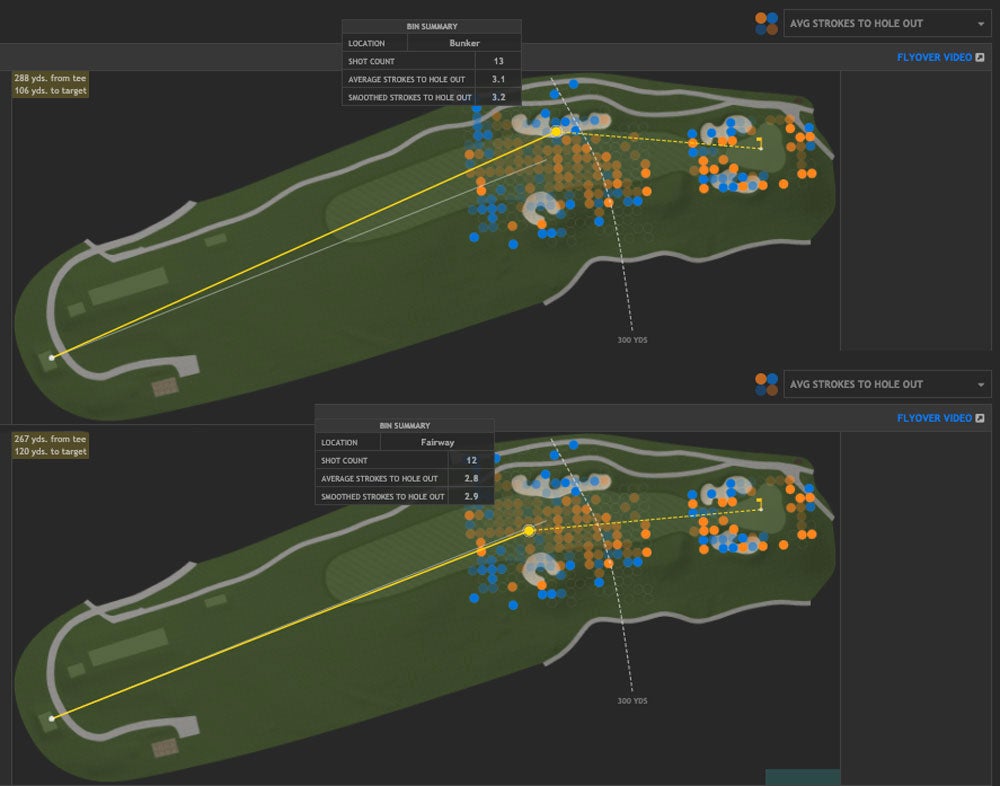
This short par-4 is really the temptress of Torrey’s front nine, as a great drive leaves just a short pitch into the green. But is it worth it, day after day, if you can’t be guaranteed to hit the fairway every afternoon? According to the DataGolf numbers, laying up short of those fairway bunkers, but in the fairway, leaves an expected strokes to hole out of 2.9, whereas the left bunker has often left players in the 3.2 range. But if you don’t have a left miss, then bomb, bomb away. Chances are you’ll carry that right fairway bunker and can still make a 3 from the rough out to the right. The angle is better, and the scores from that area have been better over time. These things are tournament-shifting quandaries the players deal with, and that fans watching at home are better off knowing.
All of it begs a new question for the data-thirsty folks, though: maybe majors should be played at Tour courses more often?