Maybe the most intriguing thing Arccos has done is bring Strokes Gained data to the masses. Doing so allows, say, an 8-handicap to find out where he’s gaining or losing strokes relative to other 8-handicaps; he can also see where he differs from, say, a 5-handicap, providing not just motivation but education and a road map for improvement.
“Breaking the goal down into achievable chunks is how you get to be the best you can,” says Arccos co-founder Syed.
Check out how recreational golfers’ games stack up against the pros with the charts below.
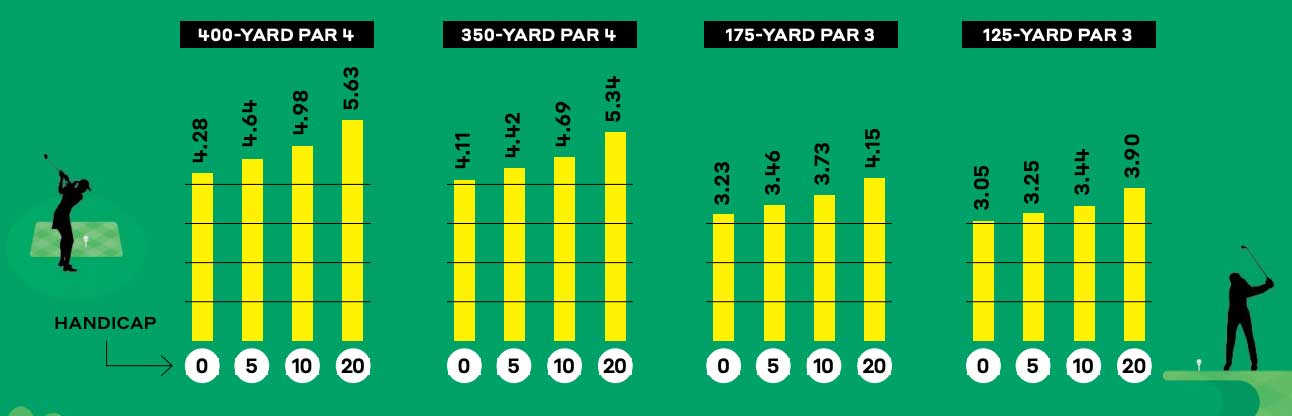
Strokes to Get Down
What it takes, on average, in strokes, to put the ball in the hole.
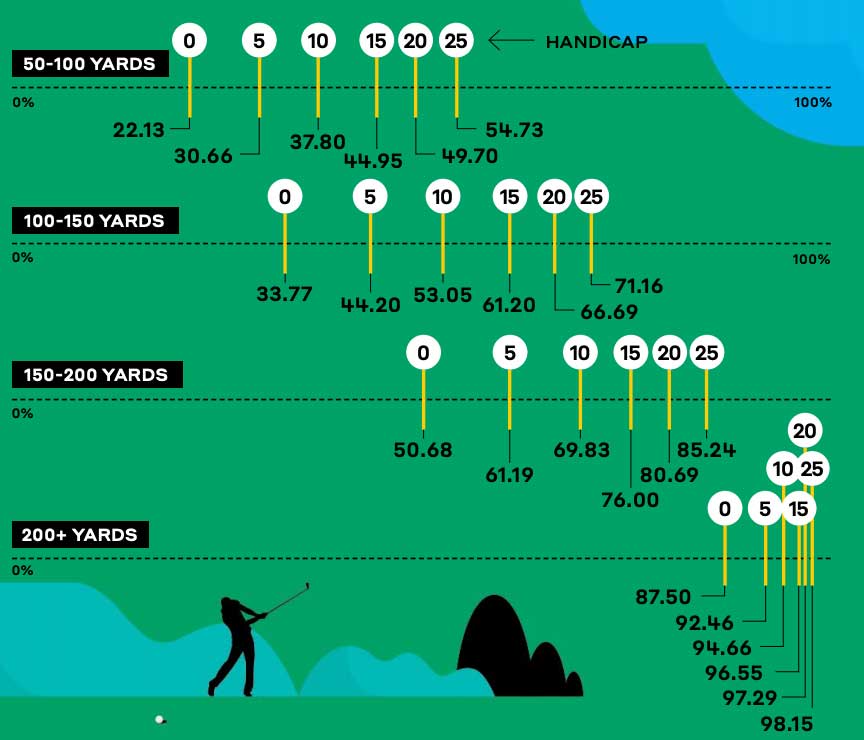
Missed Greens Percentage
Makes sense, right? The farther out we are, the unlikelier we are to hit the dance floor.
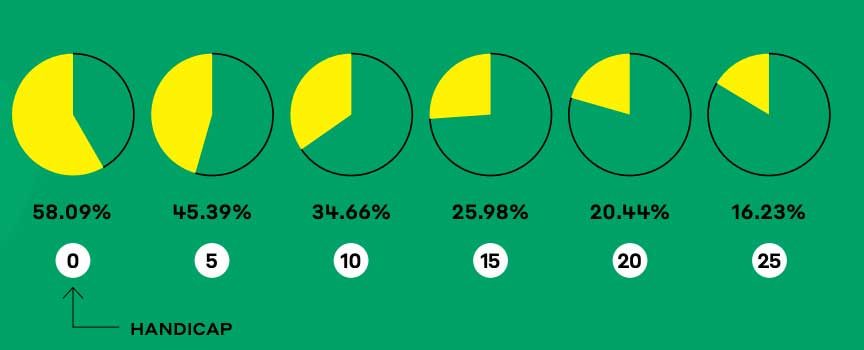
Greens in Regulation
This stat bedevils high handicappers, whose GIR numbers plunge below 25 percent.
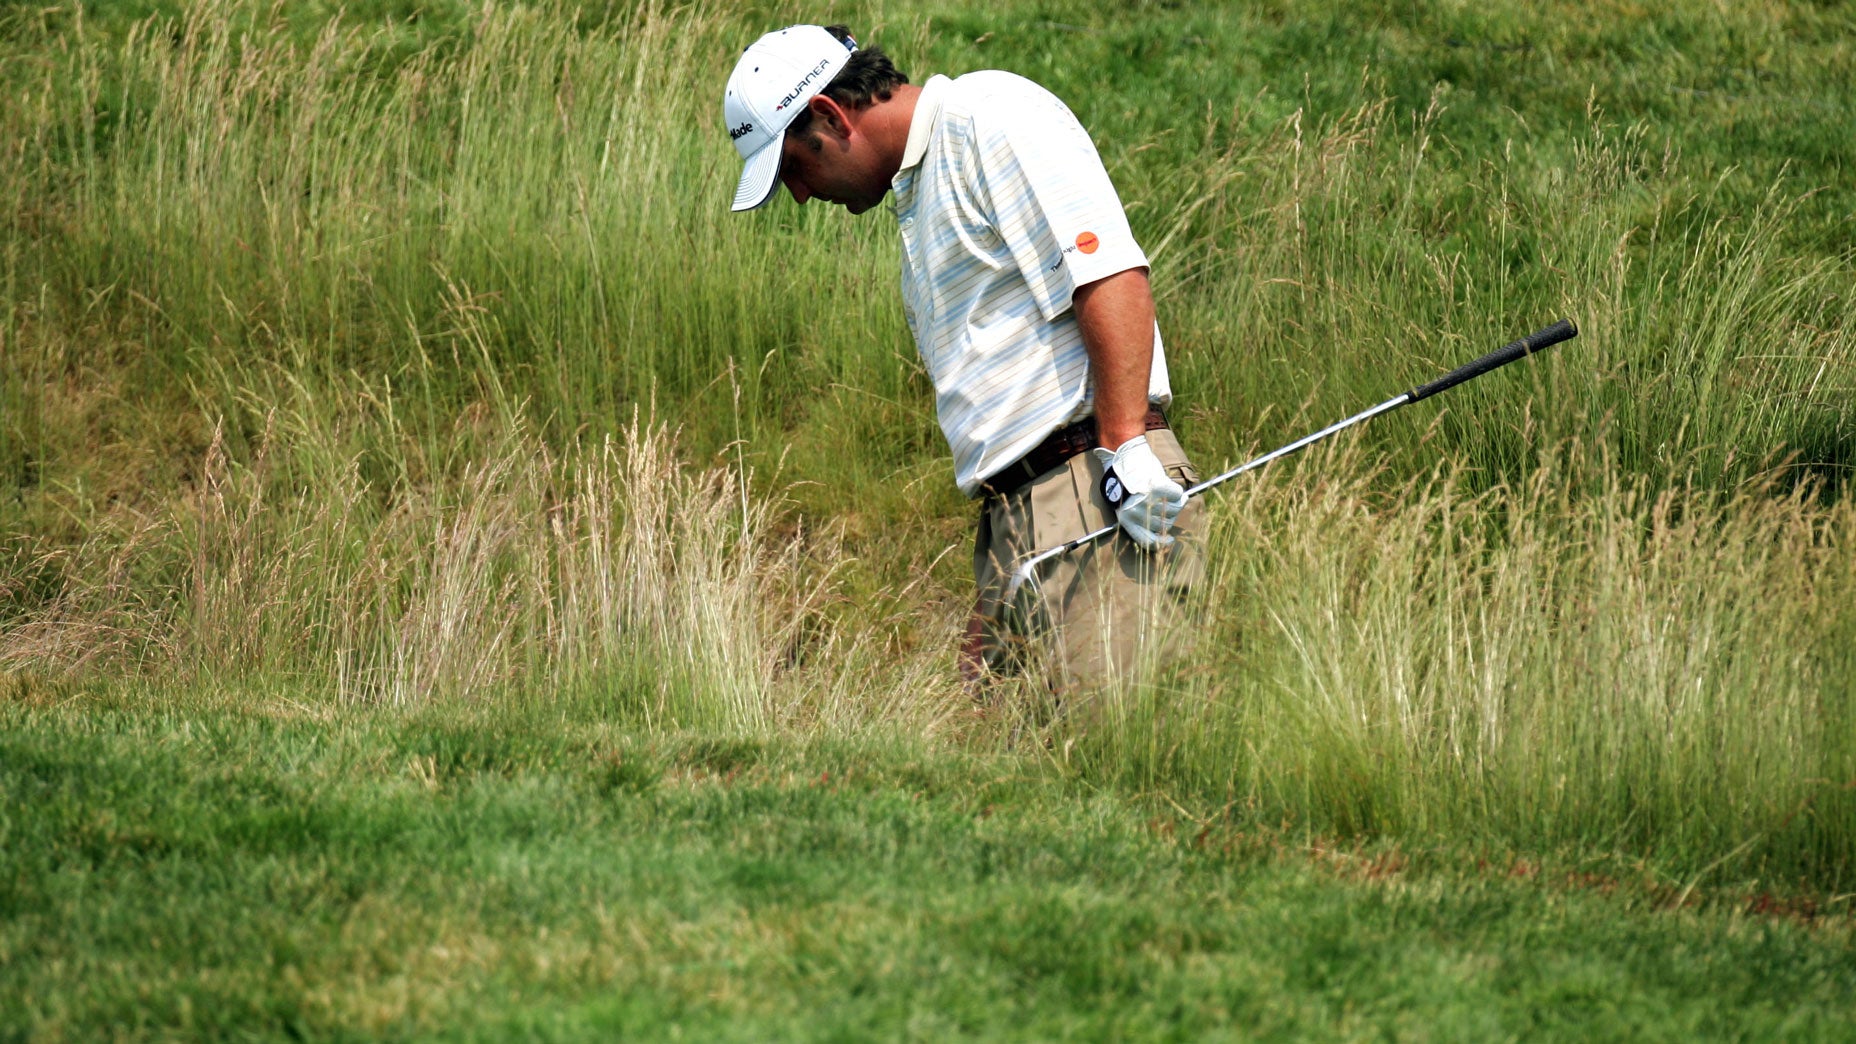
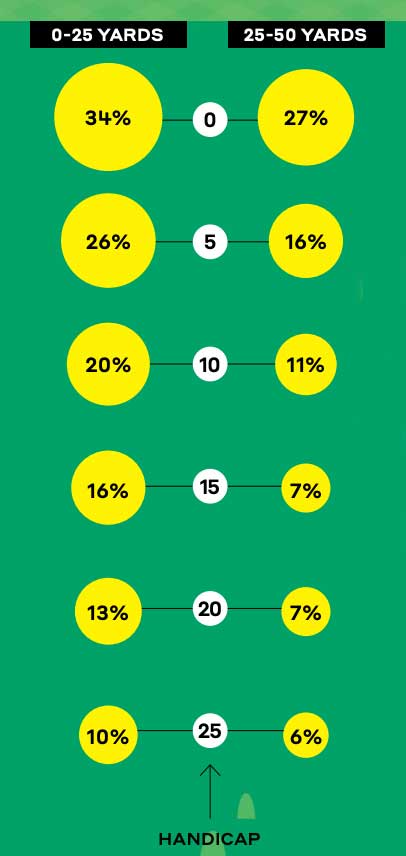
Sand Saves
How often we successfully recover from the beach (from near and not so near).
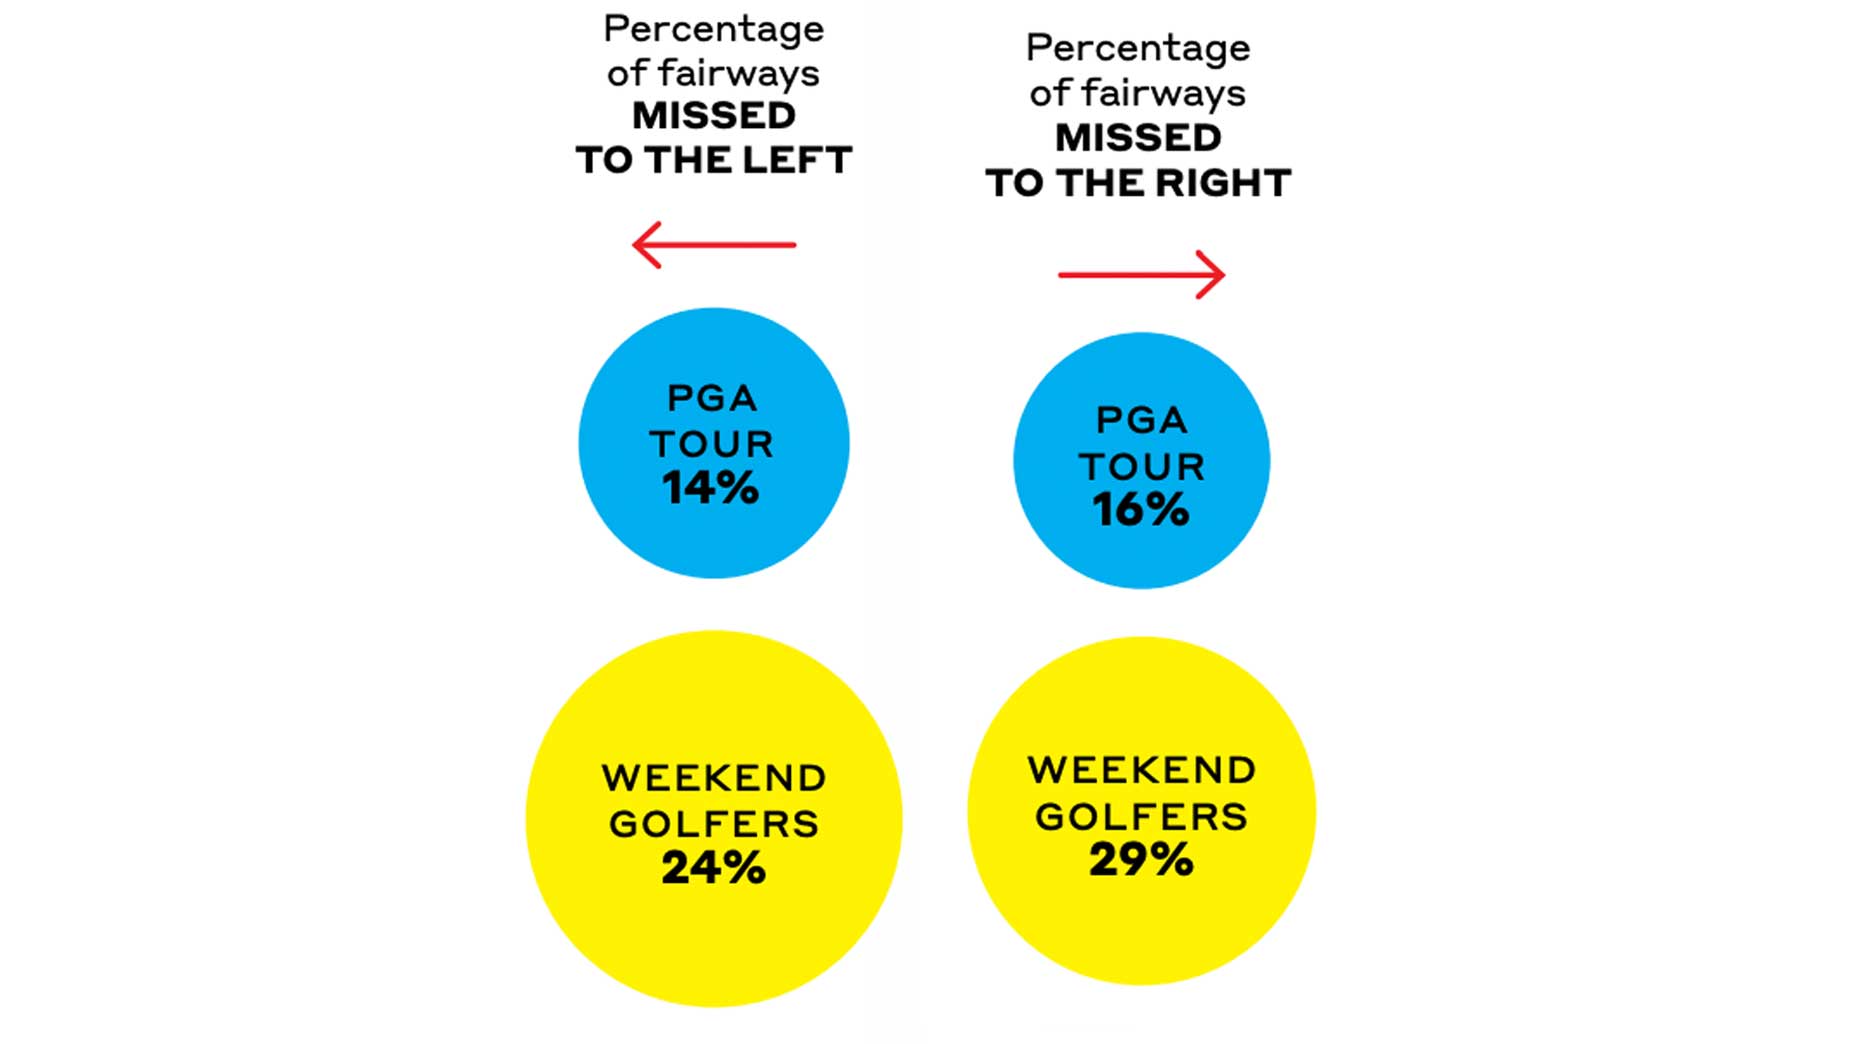
Just Like the Pros
Arccos data often shows that we have the same tendencies as the pros. We’re just nowhere near as good! Here’s one example among many.
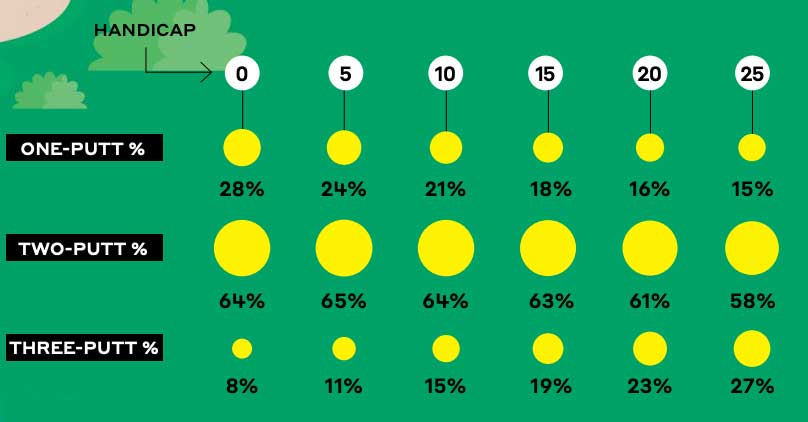
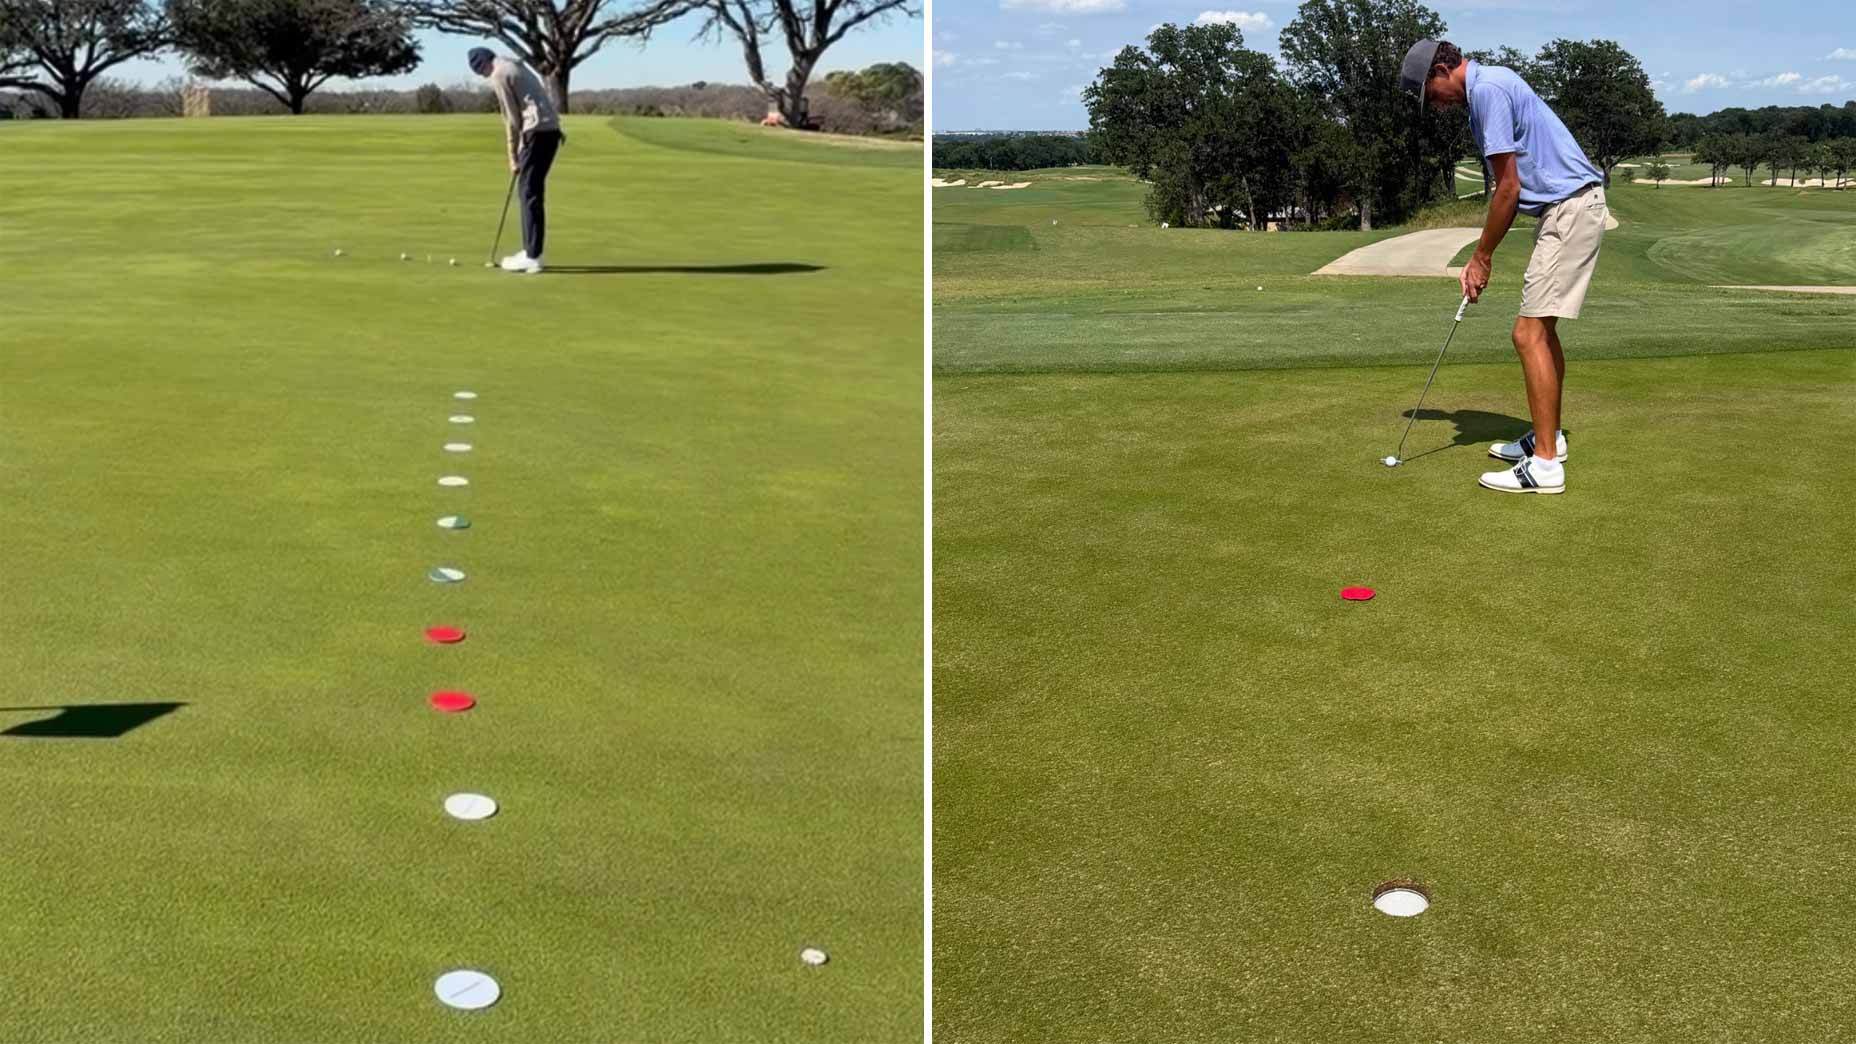
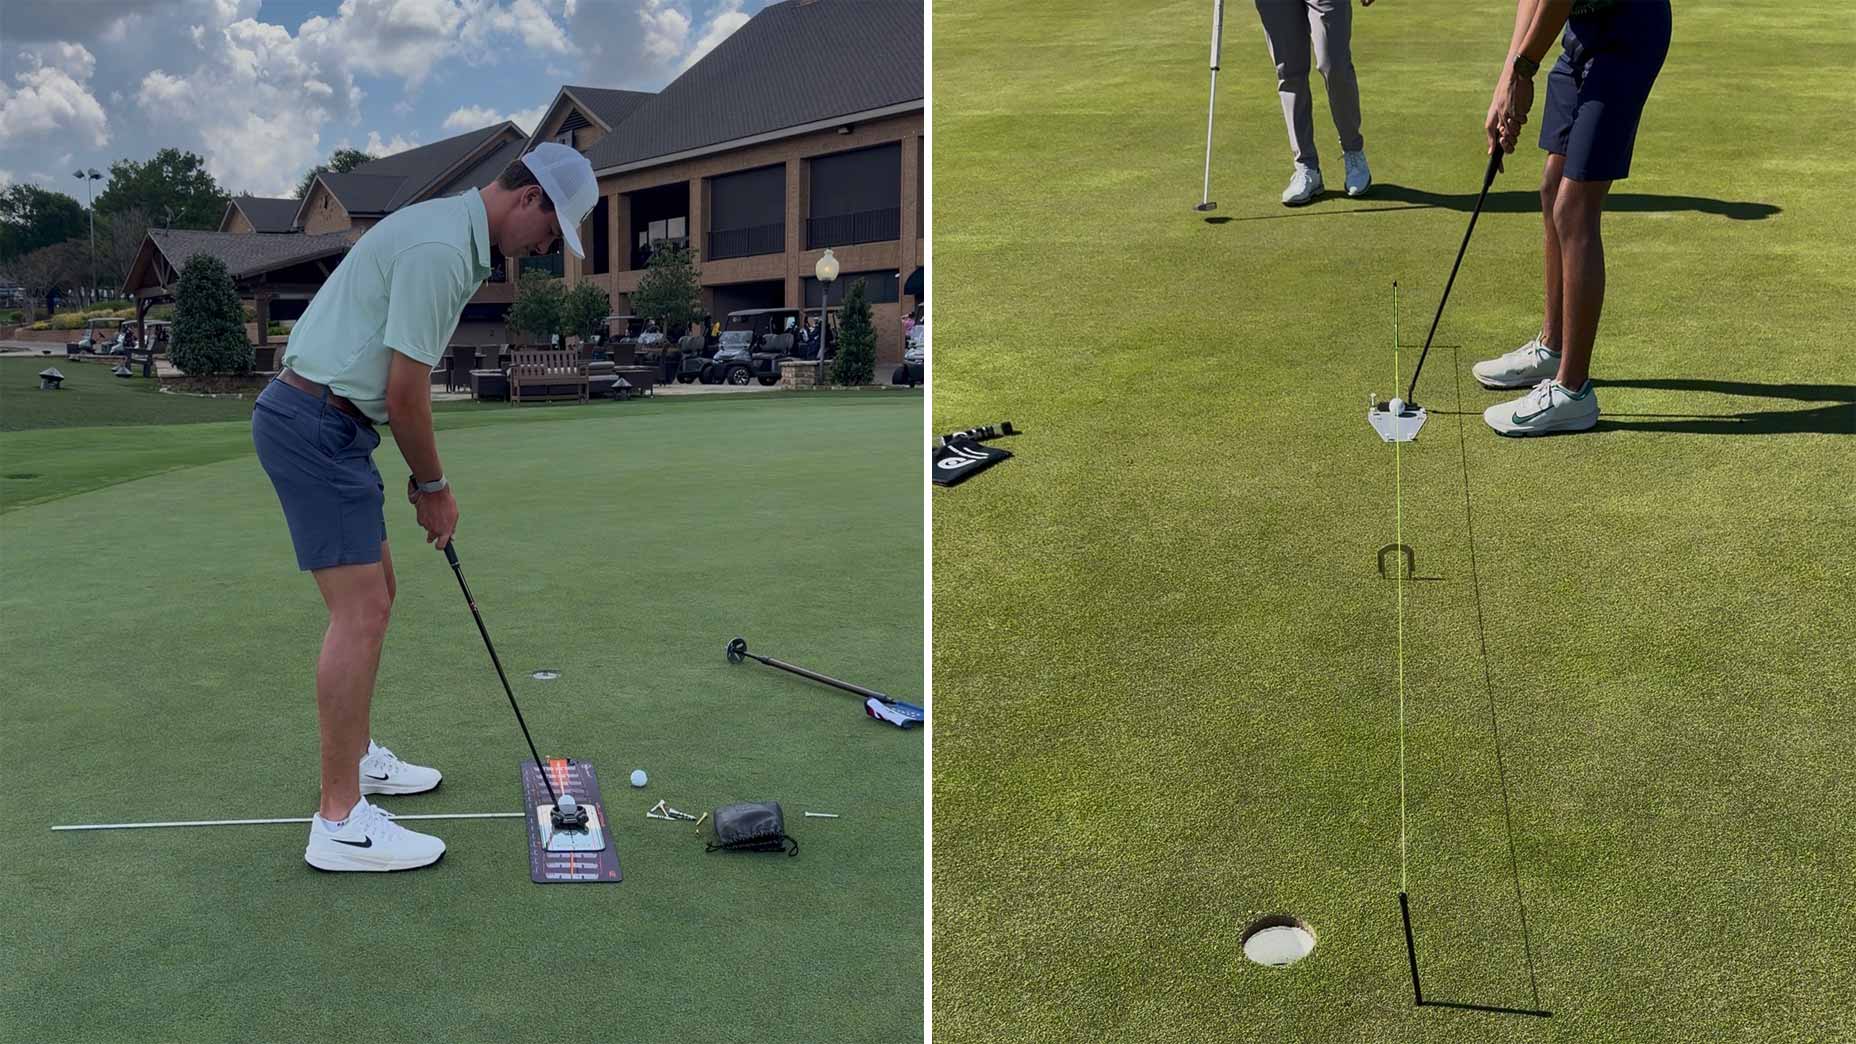
The 1-2-3 of Putting
Play 100 holes and here, percentage-wise, is how you’ll roll.