Welcome to Play Smart, a game-improvement column that drops every Monday, Wednesday and Friday from Game Improvement Editor Luke Kerr-Dineen (who you can follow on Twitter right here).
Last Saturday was my birthday, and while I’m not usually a big birthday person, I was quite excited about this one because I gifted myself a truly great present: One day of absolute control over the living-room television. No more Real Housewives, no Kardashians. Anything I wanted to watch, for one perfect day, would become a reality.
And so, on Saturday morning, I tucked into some cricket.
It was a one day T20 match between India and Sri Lanka, a format where the winner would be whoever scored the most runs in 20 overs (the cricket equivalent of innings).
In this case, Sri Lanka went first and established the total that India, batting second, set about chasing. It was at that point when I was reminded of a basic stat that really helps keep you hooked in the early innings. Without it, all you’d be left with is a team chasing a towering number, with a vague sense of how they’re doing.
Cricket calls it “run rate,” which measures how many runs the chasing team (in this case India) is scoring per over, alongside the number they need to be averaging to catch the total they need.
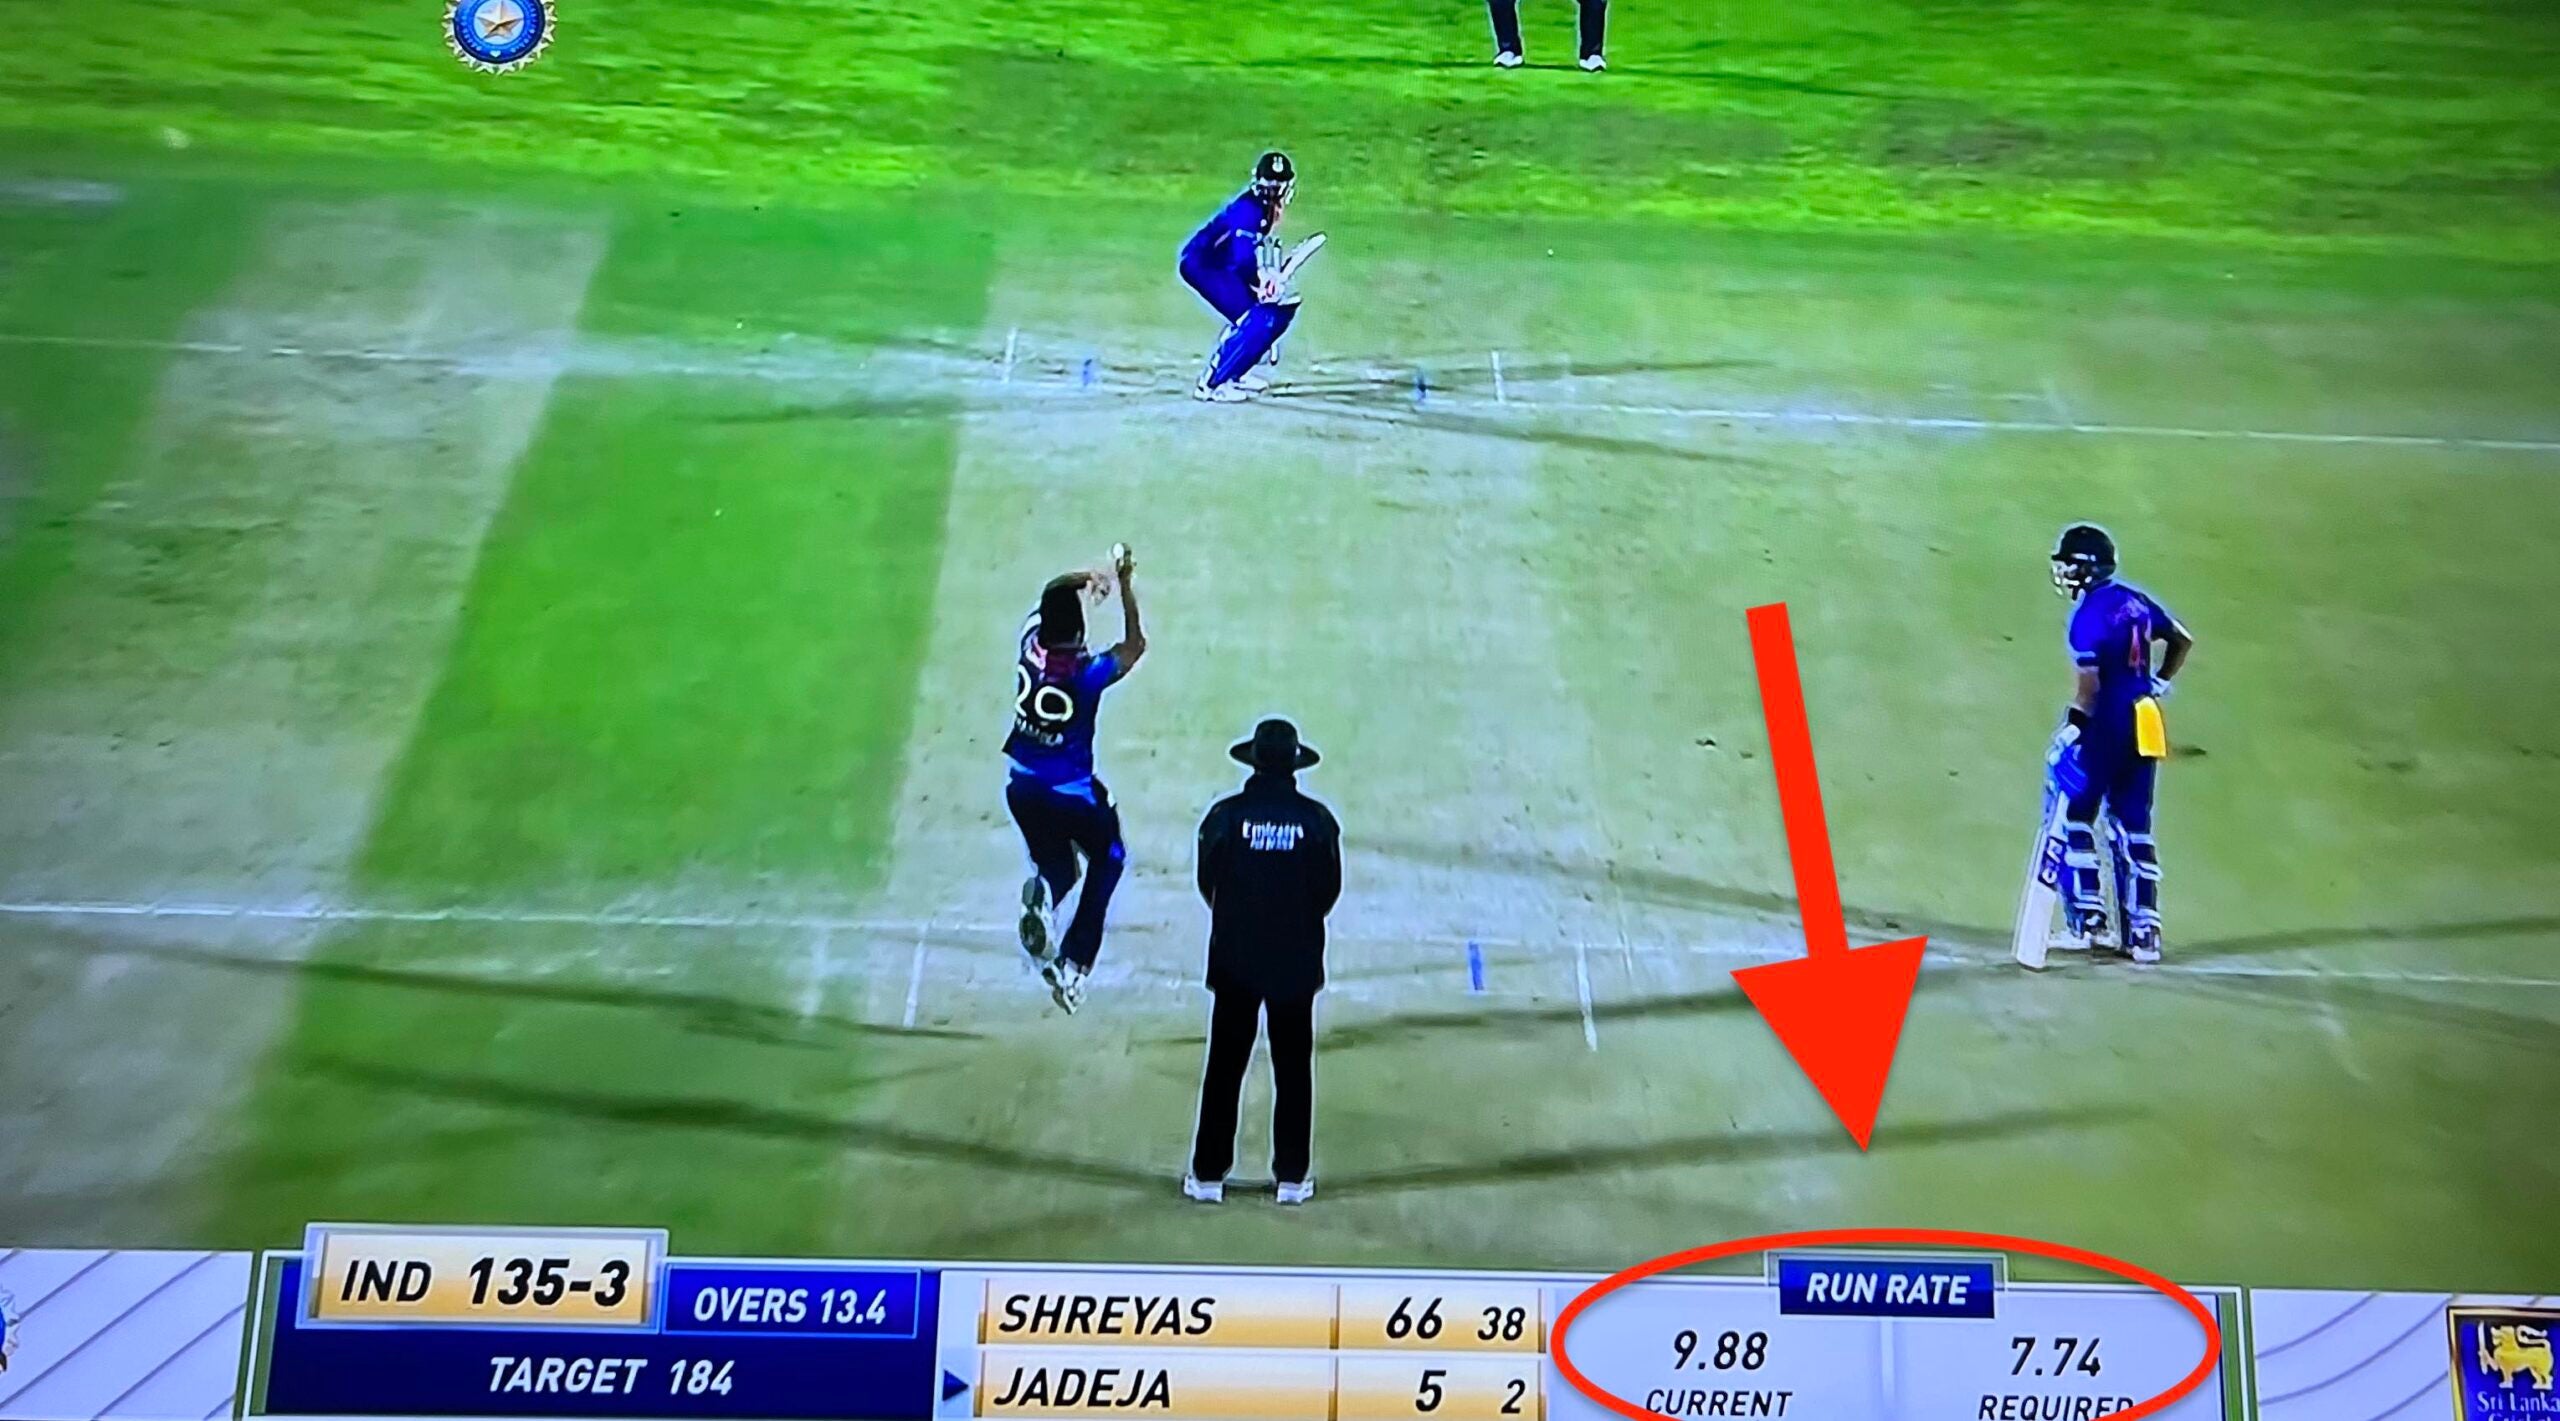
It’s a useful stat to share with viewers because it does a few things. Golf, which in some ways mirrors the T20 format, should take note. The golf equivalent would be something like “birdie rate to win” — a stat, like birdie average, that would track how many birdies players would need to average in the remainder of their round(s) to win.
Why this stat would work for golf
- The ever-present run rate stat keeps you interested and adds context in the early innings, when the total seems like a distant, out-of-reach goal.
Golf example: It gives a reason to care if the 54-leader makes a birdie on the 3rd hole on Saturday, and better yet, gives you an appreciation of its significance.
- It helps you understand how the team you’re watching is actually playing.
Golf example: If the 36-hole leader is even through his first six holes, how likely is he to hold on and win?
- It gives you a firm appreciation of big swings in momentum in the moment, instead of guessing how pivotal they are (if you even spot them in the first place) and then talking about them in retrospect.
Golf example: Player trailing by five at the start of the day birdies his second hole and eagles his third hole, making him the projected winner.
- It gives you some clarity about what it’ll actually take to win.
Golf equivalent: What do we think the winning score will be?
Smarter people than me will need to iron out the details of how birdie-rate stats would be computed, but as I see it, here are the outlines of how it’ll work:
How it would work
First, you’d need to establish a projected winning score, which would need to be continuously adjusted as the tournament unfolds. It really wouldn’t be much different than the various winning total projections that outlets like Data Golf already offer, which are pretty accurate.
From there, you’d just need to keep a rolling average of how many birdies (or eagles) each player is making, either per round or per tournament, and how that’s pacing with what he needs to be averaging to win, a stat we’d call Birdie Rate to Win (BRW).
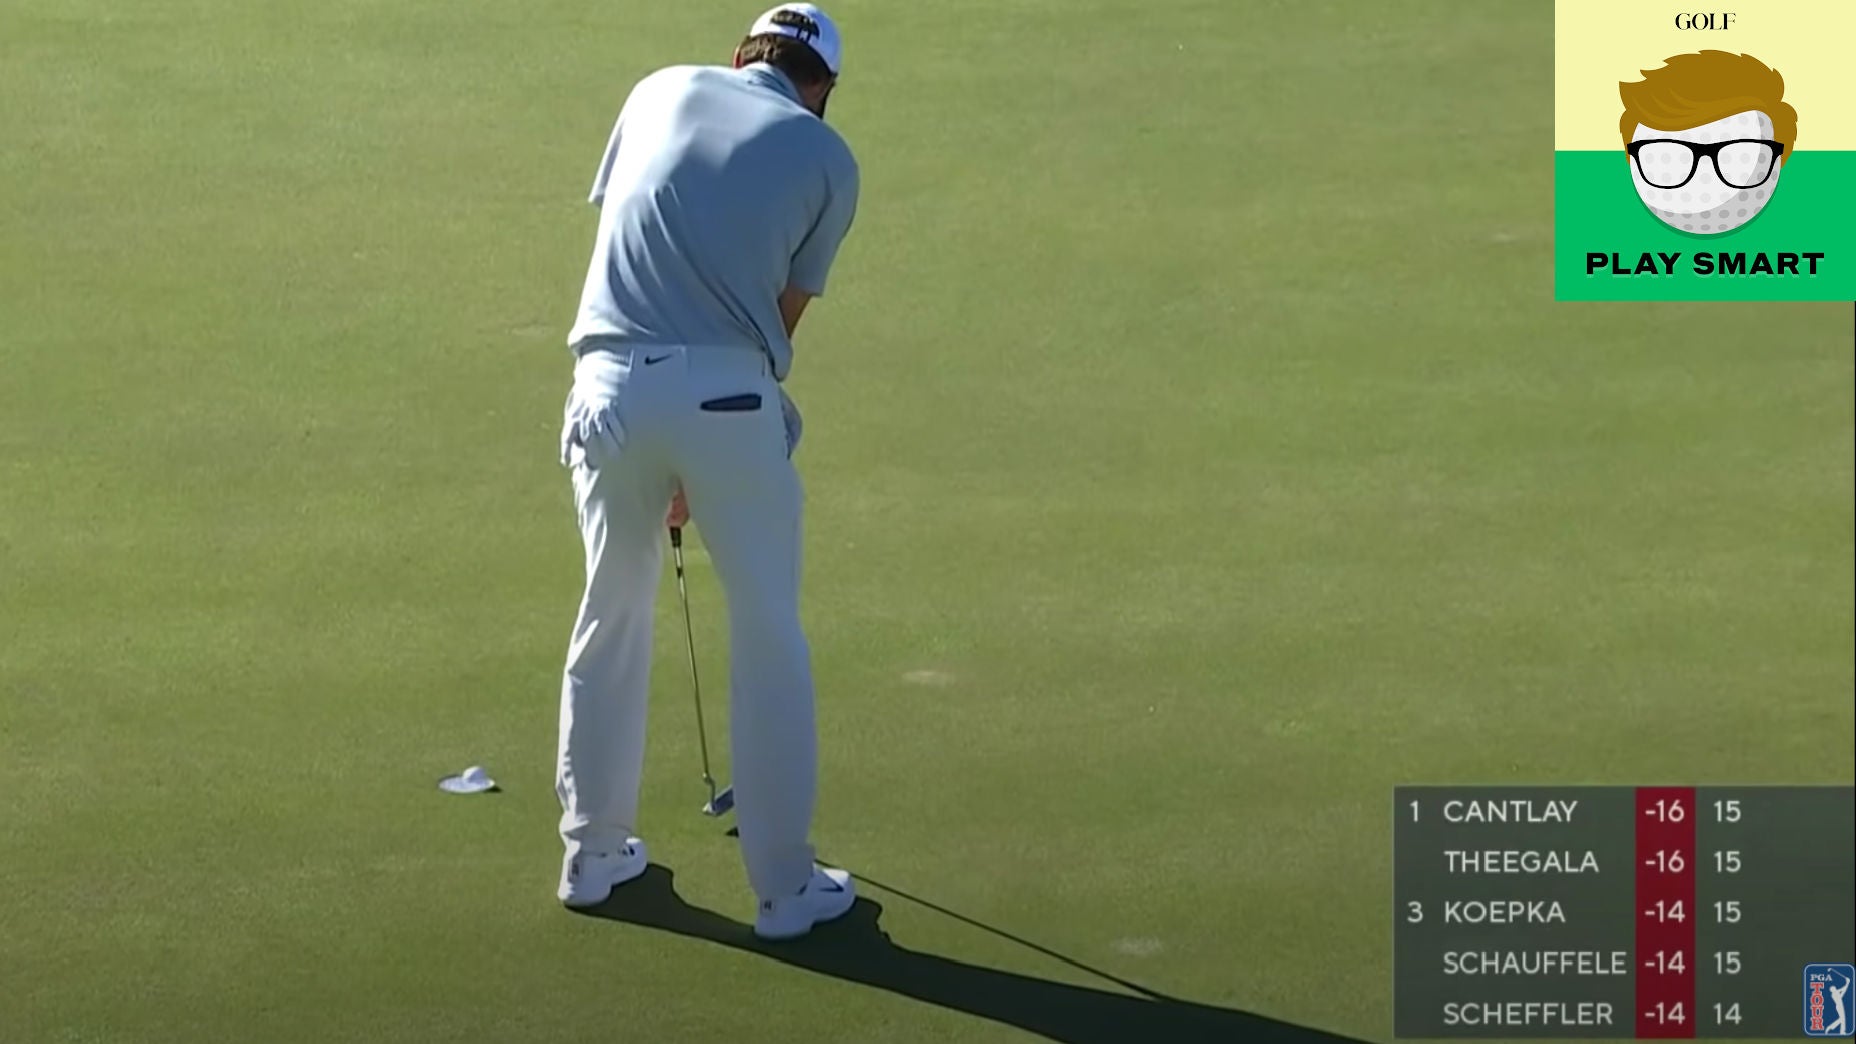
To take a recent example, this is what Scottie Scheffler’s fourth-round birdie average would’ve looked like per hole, compared to his BRW, during the final round of his victory at the WM Phoenix Open.
| Birdie Avg. (R4) | Birdie Rate to Win (BRW) | |
| 1 | 0.00 | 0.22 |
| 2 | 0.00 | 0.24 |
| 3 | 0.50 | 0.19 |
| 4 | 0.67 | 0.13 |
| 5 | 0.50 | 0.14 |
| 6 | 0.40 | 0.23 |
| 7 | 0.50 | 0.17 |
| 8 | 0.43 | 0.27 |
| 9 | 0.38 | 0.40 |
| 10 | 0.33 | 0.44 |
| 11 | 0.40 | 0.38 |
| 12 | 0.36 | 0.43 |
| 13 | 0.33 | 0.67 |
| 14 | 0.38 | 0.60 |
| 15 | 0.43 | 0.50 |
| 16 | 0.47 | 0.33 |
| 17 | 0.44 | 0.50 |
| 18 | 0.47 | 0.00 |
| TOTAL | 0.388 | 0.324 |
Granted, this isn’t the most interesting format to consume this information, but on the broadcast you’d just see two numbers: the player’s current birdie average, and his BRW. This would be especially useful for the first three rounds, especially early in the day, but it’d upgrade the final-round broadcast, too.
Scheffler, for example, birdied two of his first three holes. Ordinarily, we’d note that was interesting but that there was still much golf to be played. But a BRW stat would amp-up the excitement: Suddenly, through five holes, we’d realize that Scheffler is the hot hand and on pace to win this thing pretty handily.
But then after a three-bogey-one-birdie stretch late in the front nine, Scheffler’s prospects looked more like a toss up even though his birdie average hadn’t changed much.
That, in turn, quantifies somewhat how clutch his birdies were on 13, 14, and 15. The 14th, in particular: We’d have known, in that moment, that this tricky downhill birdie putt was essentially a must-make. The BRW stat would inject a little bit of contextual drama into the putt in front of you.

I’m sure there are probably smarter variations to this, using Strokes Gained or some other fancy projection statistic. But consider this a starting point. And rest assured, if there are other ideas I can glean from the cricket broadcasts, I’ll be sure to let you know.